
Picture a saver who has done everything right. They are 45, with $180,000 invested and about $2,000 a month still going in. They hold a sensible 60/35/5 mix of stocks, bonds, and cash, they plan to retire at 65, and they want the money to last to 95. Run that plan through 5,000 simulated lifetimes and it works in about 86% of them. By any normal measure, this is a healthy plan.
Now drop one bear market into the story. A bear market is a fall of 20% or more, and ours is a serious one: stocks lose 40% over a year before recovering. Here is the only question that matters for this article. Does it change the outcome to move that exact same crash earlier or later in the person’s life? Most people assume a crash is a crash. The size is what hurts, and when it happens is just bad luck. The simulation says something far stranger, and once you see it you cannot unsee it.
Why the order of returns matters: sequence of returns risk explained
Start with a fact that sounds like a trick. If you invest a lump sum and never add or remove a dollar, the order of your returns does not matter at all. Earn 20% then lose 10%, or lose 10% then earn 20%, and you land on the exact same number, because multiplication does not care about order. This is why a single “average return” feels so safe. On a spreadsheet with no cash flow, the average really is the whole story.
The moment you add cash flow, that safety evaporates. Once you are putting money in every month, or pulling money out every month, the order of returns stops being cosmetic and starts deciding your retirement. This is the phenomenon planners call sequence of returns risk: the danger that two people who earn the identical average return over the identical years still end up in completely different places, purely because of when the good years and the bad years arrived. The average is the same. The sequence is not. And the sequence wins.
The reason is mechanical. When you sell shares to fund your spending during a downturn, you lock the loss in. Those shares are gone, so they are not around to rebound when the market recovers. Sell enough of them low and the recovery, whenever it finally comes, is lifting a much smaller pile of money than it would have. A loss you sell into is permanent in a way that a loss you can wait out simply is not.
Market crash the year you retire vs mid-career
So we ran the experiment. One household, one allocation, one crash of the same depth and length. The only thing we changed between runs was the age at which the 40% stock crash landed. First at 48, deep in the saving years. Then at 65, the very year the paychecks stop and the withdrawals begin. Everything else, including the 5,000 market paths the household lives through, was held identical, so any difference in the result is the timing alone and nothing else.
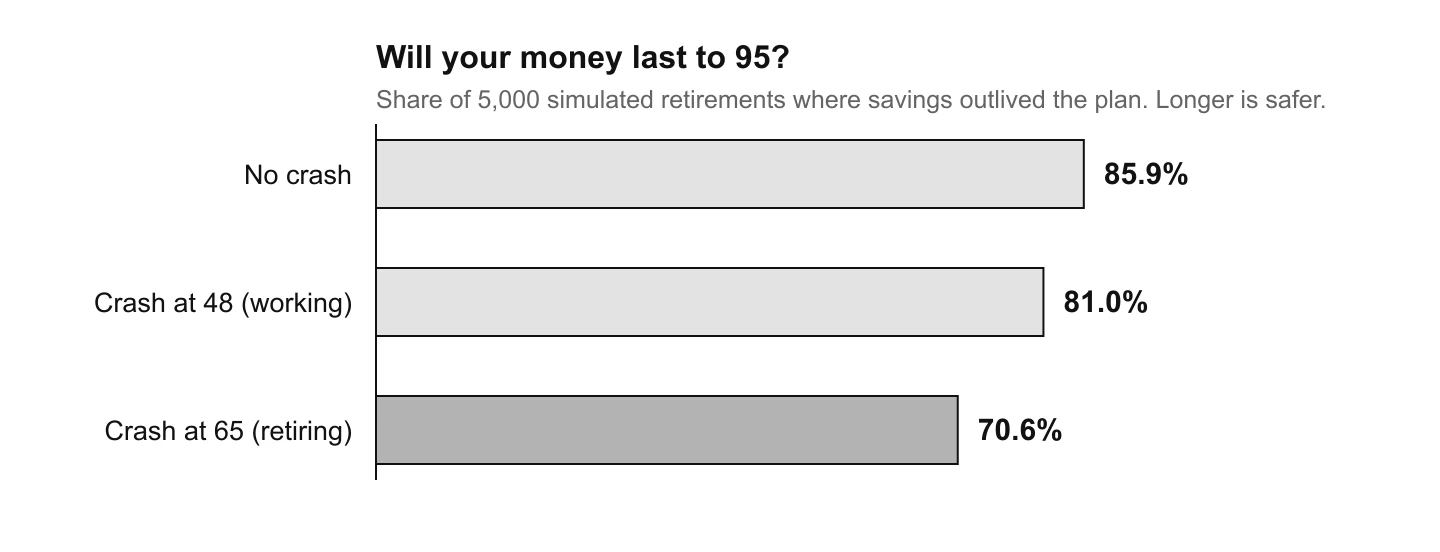
Read those bars slowly, because the gap between them is the entire point. The crash at 48, painful as it feels in the moment, barely dents the plan. It costs about 5 points of success, and then the next 17 years of saving and compounding quietly repair most of the damage. The identical crash at 65 costs three times as much. It knocks roughly 15 points off the odds and pushes a plan that looked comfortably safe into genuinely shaky territory, where nearly one retirement in three runs out of money. Same crash. Same portfolio. Same saver. Only the timing moved.
To see why the timing matters this much, follow the median saver’s balance year by year, in today’s dollars, under each crash.
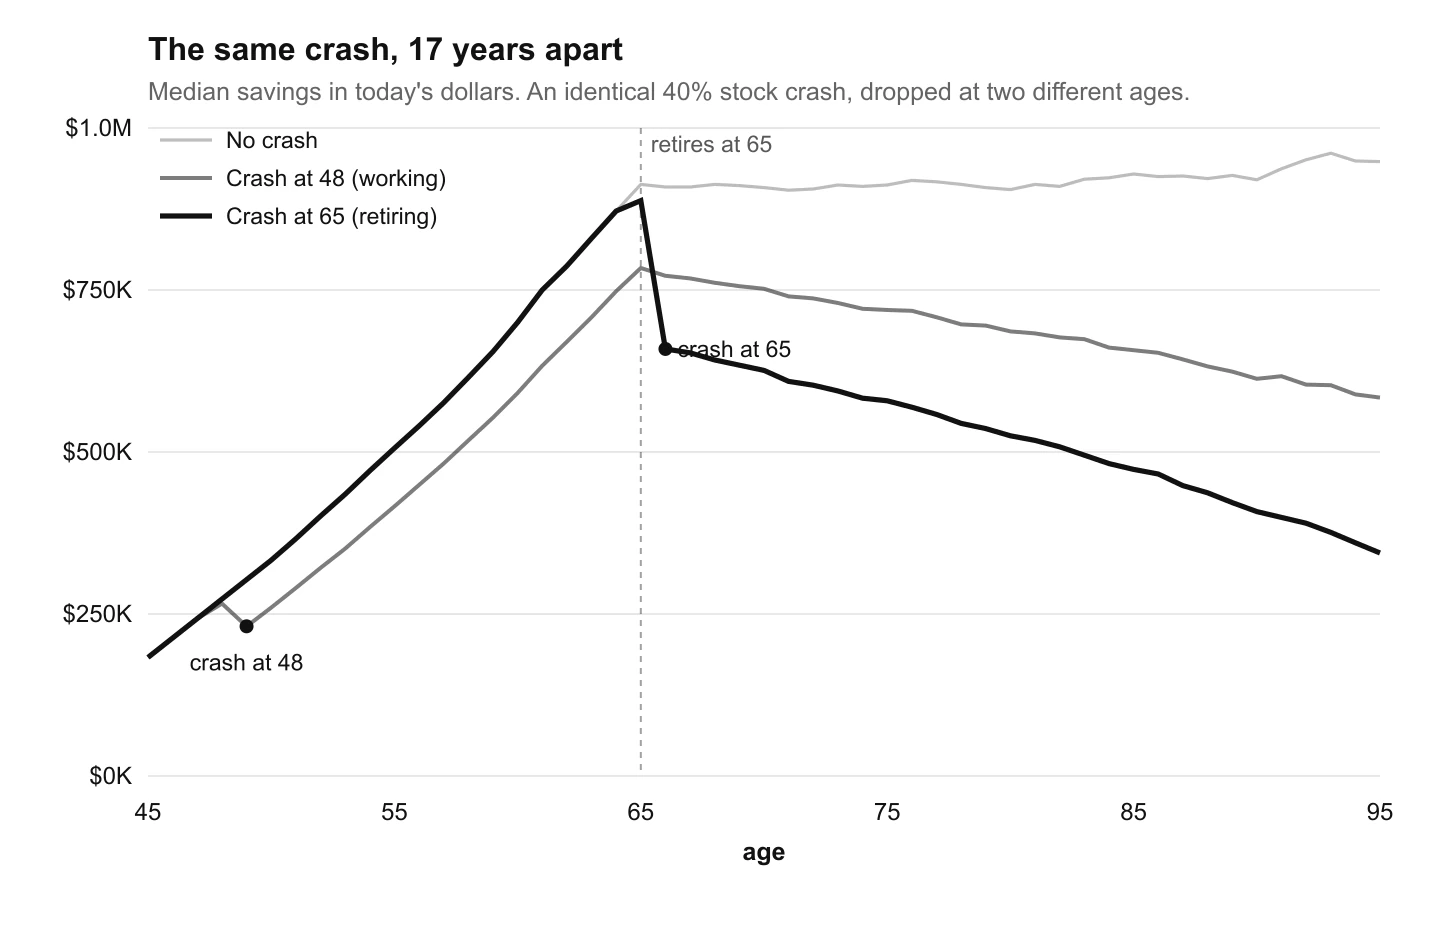
The two halves of a financial life have names, and the chart is really a story about both. The years before retirement are the accumulation phase: money is flowing in, so a crash arrives while you are a net buyer. You keep purchasing shares, now on sale, and the recovery rewards every cheap share you picked up. A drawdown, which is just a fall from a previous peak, is something you buy through. That is why the crash at 48 heals.
Retirement flips the sign. It is the decumulation phase: money is flowing out, so a crash arrives while you are a forced seller. Every month you sell something to eat, and during a downturn you are selling more shares at lower prices to raise the same income. Your withdrawal rate, the share of the portfolio you pull out each year, silently climbs as the balance shrinks, which means you are draining the account fastest at the exact moment it can least afford it. A crash in the first years of decumulation does not heal. You spend it into permanence.
How to reduce sequence of returns risk in retirement
Three honest caveats keep this from turning into doom. The first is that the early crash was not merely survivable, it was almost a gift. A 40% sale on stocks when you have 17 more years of buying ahead of you is the kind of thing that builds wealth, not destroys it. The lesson is not that crashes are bad. It is that the same crash means opposite things depending on which side of retirement you stand on.
The second is that not all of retirement is equally fragile. Sequence of returns risk is concentrated in a narrow window, the few years on either side of your retirement date, sometimes called the retirement red zone. A 40% crash at 80 barely moves the odds, because by then most of your retirement is already behind you and a smaller balance has less time left to do damage. It is specifically the crash that lands as you stop earning that does the harm. The danger is a date, not a decade.
The third is that you cannot dodge this by being clever about timing. Real markets do not warn you, and the crash that matters is the one nobody saw coming. Because you cannot move the crash, the only real defenses are structural. Holding a cash and bond buffer that can fund a few years of spending, so you are not forced to sell stocks low. Keeping your withdrawal rate modest enough to absorb a bad start. Gliding to a less aggressive mix as the red zone approaches. Staying willing to trim spending in the years right after a downturn. None of these predict the crash. They all make you indifferent to its timing, which is the entire goal.
One last point of honesty about the numbers above. They describe the median household, the one in the middle. The real pain lives in the worst tenth of outcomes, where the retirement crash is the difference between a long, secure retirement and running out of money at 84 with a decade still to fund. Averages reassure. Sequences are where plans actually live or die.
The version that is actually about you
Every figure here came from one stand in household. Your exposure to sequence of returns risk depends on details that are yours alone: how close you are to retiring, how much of your spending could flex in a bad year, how aggressive your mix is as the red zone nears, and how large a withdrawal rate your plan is leaning on. Those inputs are exactly what decide whether a crash at 65 is a manageable bump or the event that unwinds thirty years of saving.
Notes on the figures. Every number was computed from a live run of Simvora’s own simulation engine on one hypothetical household: 45 years old, $180,000 invested, adding about $2,000 a month, holding a 60% stocks / 35% bonds / 5% cash allocation, retiring at 65 and drawing roughly $2,200 a month beyond other retirement income, with the plan running to age 95. Results come from 5,000 simulations on the engine’s regime switching environment (seed fixed for reproducibility). The crash is an identical shock of about 40% to stocks spread over twelve months, applied to every world at the same age, so the only variable between the two crash cases is timing. “Money lasts” is the share of worlds that never hit zero before age 95; the balance chart shows median net worth deflated to today’s dollars. This article is educational analysis, not investment advice, and does not recommend any security, allocation, or strategy.
References
- The term “sequence of returns risk,” the danger that the order of returns, not just the average, decides retirement outcomes, is developed in the safe withdrawal literature beginning with William Bengen, “Determining Withdrawal Rates Using Historical Data,” Journal of Financial Planning (1994).
- On flexible spending as a defense against a badly timed start, see Jonathan Guyton and William Klinger, “Decision Rules and Maximum Initial Withdrawal Rates,” Journal of Financial Planning (2006).
- On the concentration of risk around the retirement date (the “retirement red zone”) and rising equity glide paths, see the retirement income research of Wade Pfau and Michael Kitces.
- For the companion case that staying invested through downturns is what makes the recovery work in the first place, see our own analysis of timing the market.